 Image Credit
Increasingly we are seeing the terms SLI, SLO, & SLA used more and more within the tech industry. These days most are at least somewhat familiar with what they are, and why they might be important, still some might conflate them with older terms and TLAs (Three Letter Acronyms) like KPIs. Others may have already taken a stab at implementing them for their team or enterprise.
There exist a number of excellent high level summaries and introductions to SLIs, SLOs, and SLAs which are no futher than a a quick Google search away. However, it has been my experience that when it comes to these three concepts: the devil is in the details. They are deceptively simple to understand, but become much more complicated when trying to actually implement.
Whether you are brand-new to these terms, or already have some understanding or experience with them. It is my hope that you will come away from this document with a comprehensive understanding of the the value, mechanics, and implementation process of these wonderful tools for understainding how to best serve your consumers.
- Brief Summary
- Service
- Service Level
- Service Level Indicators
- Rollups
- Service Level Objective
- Service Level Agreement
- Picking Good SLI/O/As
- Defining SLI/O/As For Your Service
- Conclusion
Brief Summary
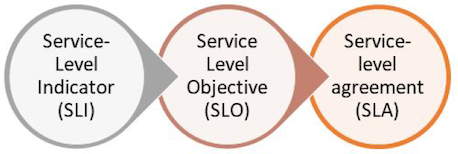
SLIs (slees), SLOs (slows), & SLAs (slaws) (sometimes rendered SLI/O/As and pronounced slee-oh-uhs) are tools for measuring, evaluating, and reporting on consumer experience with a service. They drive decision-making by highlighting where effort can be best spent.
SLI stands for Service Level Indicator and defines the criteria by which we measure how well a service is able to perform an action on behalf of consumers at a point in time. (Example: 95% of all queries in the last 5 minutes return a response in under 100ms)
SLO stands for Service Level Objective and communicates what percentage of the time we want our SLI to be true. (Example: 99.9% of the time we should meet our SLI)
SLA stands for Service Level Agreement and is an agreed upon percentage of time our SLI must be true before some consequence or business mechanism is trigged. (Example 1: We must meet our SLI 95% of the time or our customers will be entitled to an agreed upon discount or refund. Example 2: We must meet our SLI 95% of the time or all unrelated OKR work will be halted until that threshold is met.)
Simply Put:
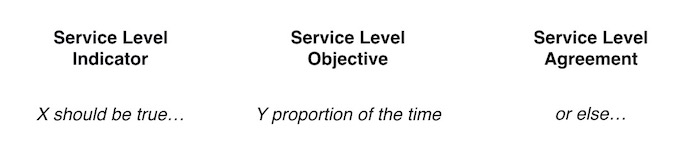 Image Credit
Service
Before diving into more detail about SLI/O/As, we should define what we mean by Service. Services are groups of machine and/or human resources which perform valuable actions on behalf of their consumers. These services expose a set of capabilities for the consumers to call upon the Service to perform. These consumers can be internal to the enterprise or external customers, and can also be either people or machines. We mostly want to focus on the services provided exclusively by computers and the code running on them, but it’s important to understand that they can also be services provided by teams or individuals to others.
Service Boundaries
In a complex ecosystem of products and the systems which support them it can be tricky to determine what groups of deployed resources constitute a service. Here it becomes very important to remember that the definition of a service is consumer focused. Thus, the question of enumerating the components that comprise a given service within complex ecosystems should revolve around answering one question: “what resources work together to provide capabilities to other groups of resources?”. The delineation between one service and another is what we refer to as a Service (or System) Boundary. These boundaries are where a service’s SLI/O/As are defined.
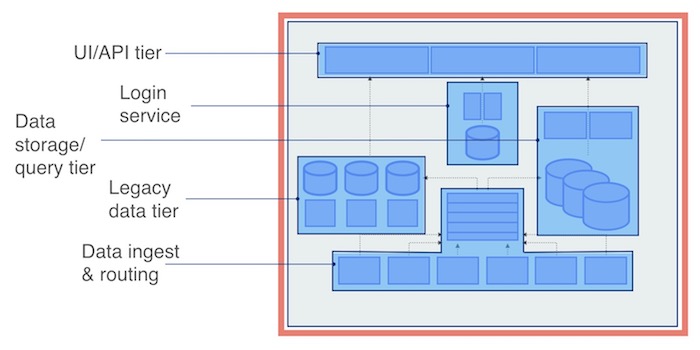 Image Credit
Importantly, services may have dependencies (critical or otherwise) on other services. Deciding whether a group of resources essential to the capabilities of one service are part of that service or a separate service unto themselves can be tricky. Splitting them will require the second service to have its own set of SLI/O/As. Keeping in mind the following can help with that decision:
- SLI/O/As are about planning and reporting, so grouping them into two separate services which will have their own SLI/O/As can provide more granularity when planning and reporting.
- Service boundaries shouldn’t usually cross team lines. Given that SLI/O/As drive planning and reporting, it is not common for a single service to have more than one team responsible for its development, or more than one team to hold the pager for it (though they don’t have to be the same team).
- How does your organization think about these resources? Do you tend to talk about them as a single unit, or multiple? This simple question can go a long way in helping you understand where your Service Boundaries lie.
The term Service sometimes gets conflated with the term Microservice. Strictly speaking, a Microservice is a type of Service, which performs a limited set of clearly-defined capabilities to support a larger application. Since they are Services, they should have their own SLI/O/As. Not all discrete workloads, however, are true Microservices. Whether or not a given Kubernetes workload is a Service unto itself should be determined by its owners and reported on separately to its stakeholders.
Service Level
Each of these Services provide a number of capabilities which they can preform either on some schedule or on demand. Some of these capabilities are critical to the core mission(s) of the Service, while others might be considered secondary in nature.
How well we perform these capabilities is what determines the “level of service” being provided. In the same way that a phone support agent might invite you to participate in a “quick survey” after your conversation to ensure that they “continue to provide you with the highest level of service”, it is important for us to measure how well our internal and external services are performing their capabilities on behalf of consumers.
For the purposes of SLI/O/As, we only care about those capabilities which matter to the consumers of the service. For example: logging and telemetry are important functions of most services, but they are not the sort of things which impact consumer experience. Thus, while many things are important to monitor, not all of them directly impact Service Level. A service which fails to emit logs may be more difficult for operation engineers to diagnose and bring back online in a timely manner in the event of an incident, but that does not tell us about the consumer experience at any point in time.
Service Level Indicators
In order to begin tracking Service Level you must begin by defining the things which matter to the consumer of a service. Those things will generally be highly contextual, and vary widely per service. Request-driven service consumers will be impacted by things such as availability and latency, while pipelines and batch processor consumers will be more interested in queue time or throughput, and storage consumers will be more interested in read/write time as well as data availability/durability.
We want to measure the status of a service as granularly as possible so that we can know where to focus our energies towards improving consumer experience. Since services will often have multiple capabilities and multiple factors which impact the consumer experience with each of those capabilities (such as: success rate and speed of response), it is difficult and unhelpful to reduce service level down to a single measurement.
Thus, for each of these capabilities we should define one or more measurements which indicate how well they are acheiving their purpose at a given point of time. The definitions for these measurements and the established parameters they are expected to fall within are what we refer to as Service Level Indicators.
Metrics vs. SLIs
It is a subtle but important distinction to differentiate between an SLI and the metric(s) that inform it. Properly used, the term ‘SLI’ refers to a written definition of what is being measured and the expected parameters that measurement should fall within (e.g. 90th percentile under 100ms, or probe success), though the term sometimes is conflated with the set of metrics used to inform it.
SLIs are always an evaluation of truth; as in X should be true. X here refers to the question of whether some metric is within established parameters during some window of evaluation. Such as: 95% of all queries in the last 5 minutes return a response in under 100ms.
The history of the SLI is therefore not the history of the metric, but the history of whether the metric was within established parameters during the specified window.
Types of SLIs
SLIs can tell us a number of different things about our services. There are 7 industry standard types of SLIs:
- Availability
- Latency
- Quality
- Freshness
- Correctness
- Coverage
- Durability
Most services will not require one of each of these SLI types, though it is possible to have multiple of the same type on a single service. You must evaluate a service’s capabilities and its consumers’ needs carefully to select the SLIs that make the most sense for a given service.
There are two main strategies for defining most of these types of SLIs, Probe or Telemetry based:
- Telemetry-based definitions are built around the aggregation of usage and behavior metrics for the service, such as response codes or performance telemetry. The state of the SLI is based off the percentage of recent metrics meeting some criteria.
- Probe-based definitions are built around one or more scheduled probes of the service that make specific requests and check the result. The state of the SLI is based off the most recent probe result(s).
Telemetry-based SLIs have the benefit of telling you about actual user experience; however, on quieter services they can be easily skewed by user error if not defined very carefully. On such quiet services, you may still need to set up a probe to ensure some traffic is always present, and thus avoid being caught off guard if a problem develops and worsens while no telemetry is being produced. This can also help smooth your data for better reporting.
Probe-based SLIs have the benefit of knowing that they should always succeed, since you are in control making sure they send a well-formed request; however, they suffer from the fact that they might be too narrow in what they test to provide a complete view of the service’s health, and may not accurately reflect user experience.
A third, unique, SLI definition strategy is an Event-Driven SLI. In these cases the SLI evaluates the performance of each individual event or transaction that occurs on demand, as opposed to the result of a synthetic probe. This strategy is most useful when measuring customer service interactions and other long-lived transactions.
Availability SLIs
Availability SLIs are the most straightforward kind of SLI. Simply put: availability SLIs measure that a successful response can be returned from a request to the service. Typically, for HTTP services, this will look at the response codes returned. But other types of services may use other protocols, including even ICMP Pings.
It is important to have a clear definition of what success looks like. In the case of HTTP services, 500s are clearly errors, but are 200s the only kind of success? Do 400s only represent user error, or could they also signal underlying problems with the service, such as missing data?
Examples
Telemetry:
- 95% of HTTP requests over the last 5 minutes returned a status code between 100-499.
Probe:
- 100% of probe requests in the last 5 minutes returned a 200 status code.
The Uptime SLI
There exists a special kind of Availability SLI, which represents your service’s Uptime, and answers the question: “Is the service able to perform its core functions?”. It might be the only Availability SLI you define on some services, but while an Availability SLI could possibly be limited to only part of your service’s overall availability, the Uptime SLI is always holistic.

One could also define this SLI based off of other existing SLI definitions, where some percentage (or all) of the SLIs must be true in order for the service to be considered up. This group of SLIs which inform the Uptime SLI could theoretically be of any type, but should include Availability SLIs. The underlying SLIs should also have the same sample rate for easier calculation.
Whichever strategy is used for this special Availability SLI, it should accurately represent that your service is able to perform its core mission at a minimum level.
Latency SLIs
Latency SLIs measure how long it takes to complete some task. This is usually the round-trip time for a request.
Examples
Telemetry:
- 95% of HTTP requests returning a status code between 100-399 over the last 5 minutes completed in under 100ms.
Probe:
- 100% of probe requests in the last 5 minutes got a response in under 200ms.
Quality SLIs
Quality SLIs are particularly useful for services that can degrade gracefully, such as ones that can use cached data when backends become unavailable, or which stream transcoded data at a variable rate of lossiness depending on system load. They can measure the quality of the data being served, such as the percentage of data served directly from the system of record as opposed to from a cache. They can also be used to evaluate other things about the quality of data provided.
In order to use a probe-based SLI for this type, the response data must include something for the probe to evaluate the quality of its response.
Examples
Telemetry:
- 90% of HTTP requests returning a 200 status code over the last 30 minutes provided non-cached data.
- 90% of clients were served a stream at their requested bitrate over the last 5 minutes.
Probe:
- 95% of probe requests in the last 30 minutes received non-cached data.
- 90% of probes in the last hour successfully streamed at the requested bitrate.
Freshness SLIs
Freshness SLIs are most useful for pipelines, and measure how recently data has been updated. It can either measure the age of the most recent record processed (useful for sequential pipelines like queues), or the percentage of records older than some time threshold.
For data being processed for user consumption, it may be valuable to factor in the historical usage for the records being processed by the pipeline. Thus you might define an SLI for the percentage of records accessed by X% of users which have been updated within some time threshold.
Examples
Telemetry:
- The AWS Kinesis Stream Consumer’s Iterator Age is under 5 minutes.
Probe:
- 90% of synthetic messages placed in the queue in the last 30 minutes were processed in under 5 minutes.
Correctness SLIs
Correctness SLIs measure the accuracy of data. This can be a tricky type to implement, since you will generally need an external system of record or auditor to validate data. However, it is also possible to set up synthetic probes which can evaluate this. Although less valuable than a mechanism for auditing the correctness of your data as a whole, it can still provide a key indication of your system’s ability to serve expected data.
Such a synthetic probe could write some predefined data and then validate that it can be read, and that the data coming out either matches the data written, or that it matches the expected transform the system should produce.
Examples
Telemetry:
- Difficult to do. But could possibly be done with something akin to a Cyclic Redundancy Check, or perhaps an internal subroutine that performs some data validation.
Probe:
- In the last 5 minutes 100% of all golden inputs when retrieved matched the expected output.
Coverage SLIs
Coverage here refers to a concept similar to bandwidth, but with some nuances. It measures the amount of available valid data processed within a given period.
Examples
Telemetry:
- 90% of the number of records input into an AWS Kinesis Stream over the last 10 minutes (minus the count invalid records reported by the stream consumer) were processed successfully by the stream consumer.
Probe:
- Likely not possible to do, since this SLI type deals inherently with the holistic performance of system, and cannot be driven by the results of a single synthetic.
Durability SLIs
Durability SLIs measure that data stored in a system will not be lost. Data can be lost through a number of means, including storage medium corruption and/or failure, program or operator error, ransomware, and even bitrot. Protecting against this through proper backup strategies, can reduce the risk of data loss to near zero, but can never reach zero. Thus reporting on this SLI for storage systems is important.
This SLI type can be tricky to instrument. Telemetry-based definitions require knowing if a specific requested record is expected to be available at all. This issue is further complicated when records are accessed by open-ended queries where it can be difficult to determine from the request what records are expected to be returned. Probe-based definitions might be more appropriate but would require an external record to validate against, and could be I/O intensive.
Instead, a more realistic approach might be to use data-loss reports (from both operators and users) as the telemetry source to drive the SLI. This has the benefit of being simple while still reflecting user-experience. Though it is generally best practice to instrument your SLIs in such a way that its violations could be discovered before a user notices, so that it can be corrected as soon as possible, there is not usually a way to correct data-loss.
An alternative probe-based definition could be constructed around data integrity audits, where backups are periodically inventoried and tested to ensure that all expected data is retrievable. However, an audit could still miss lost data, so using a hybrid definition that combines both telemetry and probe based definitions could be more robust.
Examples
Telemetry:
- 0 unrecoverable data-loss incidents over the last 24 hours.
Probe:
- 100% of data integrity audits over the last quarter reported no lost data.
Anatomy of an SLI Definition
Once you’ve selected what SLI types make sense for the capabilities of your service and the metrics you’ll use to evaluate them, you need to craft your SLI definitions. Each SLI definition should be crafted to meet the specific realities and requirements of your service and the capability measured by the SLI.
Each SLI definition should include the following information:
- The Metric(s) in question. What is being measured?
- The Evaluation Window. Over what period of time are we evaluating the Metric(s)? If this is an Event-Driven SLI then the Evaluation Window is just a single event instead of a period of time.
- The Normal/Established Parameters for the Metric(s). What should be true about this(these) Metric(s) throughout the Evaluation Window?
- The Sample Rate. How often should the Metric(s) be evaluated against the Normal Parameters of the SLI? This will usually be the same period as the Evaluation Window, but there are situations where you might want it to be shorter; such as those where you are tracking a trend. Event-Driven SLIs are just sampled on each event.
SLI Specifications
While SLI definitions are highly contextual, and should be considered and crafted for each Service and its associated capabilities separately, often many services will need very similar SLIs. Sometimes you may want to establish a policy that, within a team or organization, all services will have some set of baseline SLIs. Enter the SLI Specification.
SLI Specifications are SLI Definitions which are missing details about their precise Evaluation Window, Normal Parameters, or Sample Rate (and often all three). They are essentially templates that can have their details filled in for each service they are applied to, and can be quite vague, even about the precise metrics used to inform them. An SLI Definition based off of an existing SLI Specification is sometimes referred to as an SLI Implementation.
Some Standard SLI Specifications:
- Availability: The proportion of valid requests served successfully.
- Latency: The proportion of valid requests served faster than a threshold.
- Quality: The proportion of valid requests served without degrading quality.
- Freshness: The proportion of valid data updated more recently than a threshold.
- Coverage: The proportion of valid data processed successfully.
- Correctness: The proportion of valid data producing correct output.
- Durability: The number of records permanently lost during some time period.
Others can also be defined that either measure different things or use more specific criteria.
SLI Instrumentation
Finally, SLI Instrumentation refers to the actual probes, telemetry data, and aggregations, required to produce the underlying metrics and perform the necessary calculations to evaluate the SLI. Once you’ve settled on what your SLIs will be, ensuring that you are able to collect the required data to evaluate them as well as to report about them on an on-going basis, is an essential next step and is what SLI Instrumentation is all about.
Rollups
While the history of an SLI is always expressed as a time-series (i.e. a series of point-in-time evaluations of its truth or falsehood), SLOs and SLAs are both expressed as thresholds that a Rollup of the SLI’s history is evaluated against.
How to Rollup
A Rollup is made by taking the time-series of an SLI during some period (such as a month or a year) and calculating the percentage of times an SLI was true.
So if my roll-up window was 30 days, and my SLI was evaluated every 5 minutes, I would have 8640 samples. If 8635 of those samples were true then my roll-up would be 99.94% (8635/8640=0,9994212963).
Rolling vs. Fixed Windows for Rollups
Whichever time-frame is selected for a roll-up, one needs to decide whether it will be calculated using either a rolling or a fixed window.
Rolling windows evaluate a fixed number of the last data-points. They allow you to see the roll-up change in real time, because they only evaluate a fixed number of the last data-points. So if an SLI produces a data-point every minute, and we want to know our roll-up over the last year, then we evaluate the last 525,600 data points.
Fixed windows are only really useful when evaluating passed performance over multiple periods, such as performance during each month of the prior year. They are less useful for telling you how you are doing right now, since your roll-up does not provide an accurate picture of performance within the window until that window has completed.
Rolling Windows can also be used when calculating historical performance, because they essentially produce a new time-series of data (which can be generated on demand from the existing data) where each data-point represents the roll-up at that point-in-time. You could then see the roll-up month-over-month by averaging the values of this series for each month.
Whichever strategy you use, it should be the same used for both the SLO and the SLA roll-ups for that given SLI.
Maintenance Windows and Planned Downtime
A big decision to make when determining how to calculate your rollup is whether or not to include maintenance window periods as part of the calculation. Maintenance Windows are pre-defined and communicated blocks of time when a service is expected to possibly become unavailable (generally as part of an upgrade or perhaps rolling back and upgrade gone wrong). During a maintenance window both performance and availability can be impacted for long stretches during the window without resulting in the creation of an incident or SEV. As such, including maintenance windows on services that often become temporarily unavailable during some portion (be it large or small) of a maintenance window can have a very significant effect on the out come of the rollup.
Both strategies have their merits. Skipping the Maintenance Windows in the rollup calculation will communicate what percentage of those times when the service was expected to perform at full capacity it succeeded in doing so. While including those time periods will give an accurate picture of a service’s overall availability around the clock, but will likely have at least some negative impact on the result of the rollup (which may cause the service to appear less reliable than it really is in practice).
Services which have mature CI/CD pipelines and high-availability, or which also make use of canary releases, will probably benefit more from including maintenance window periods in the rollup calculation as opposed to excluding the metrics generated during them. While on the other-hand, those services that regularly become unavailable to all users at some point during their release should probably opt for excluding maintenance windows.
On the other-hand, Planned Downtime (which is a time when the service will explicitly be made unavailable), that is not part of an established maintenance window should generally not be skipped since it is usually exceptional in nature and not part of the pre-defined expectations of consumers.
Service Level Objective
Service Level Objectives represent the desired range within which you want an SLI’s rollup to be kept. This range should not be too aspirational, but instead defined based off both passed performance and customer needs. At times this may mean your SLO should be above where you are currently performing, but it should still be realistic.
One of the most important pieces of value SLOs provide is an indication of where work should be prioritized. If consumer need requires an SLI Rollup to be above where you have historically performed, and you define an SLO which you are thus immediately failing to meet, then you know that should be prioritized very high among all other efforts.
This is also why SLOs should be defined as a range of values for an SLI’s Rollup, with both upper and lower bounds being clearly defined. Going out of SLO on either side is not desirable, since even positive performance in excess of you SLO may either require an excess of resources (computational or human) to obtain and/or maintain; while these resources might be better spent elsewhere. Additionally, out performing your SLO might cause users to grow accustomed to a level of performance that is higher than you can afford to maintain, and will thus feel that your service is under-performing later when you can no longer continue to deliver that performance. As always with SLI/O/As, picking a good upper-bound is highly dependent of the unique character of your service. For many services an upper-bound of 100% is just fine, but it should be a deliberate choice.
Error Budgets
Failing to reach the lower-bound of your SLO is referred to as an SLO Miss and tells you that a service needs attention. There may be consequences for missing an SLO, such as halting feature deployments or deprioritizing other work within the team(s) responsible for this service in order to focus on improving the service’s reliability.
Together, SLIs and SLOs establish what your service’s overall tolerance for failure is. Should an SLIs underlying metric(s) fall outside of its normal parameters more often than is allowed by your SLO then you’ve exceeded the Error Budget. Exhausting an Error Budget is really just a different way of thinking about SLO Misses, but can be a helpful recontextualization of the problem when trying to pick the right parameters for an SLI and the right lower-bound for its SLO.
The corresponding Error Budget for an SLO is expressed as 1 minus the lower bound of the SLO. Thus if my SLO’s lower-bound is 99.9% my error Budget would be 0.001 (1 - 0.999) or 0.1%.
Set SLOs & Measure Their Performance Granularly
Services rarely live simple lives. It’s very likely that your service is deployed in multiple environments, such as Dev, Sandbox, Production, and Production EU. When setting an SLO it’s quite possible that you don’t need or want to target the same level of performance in each of these environments, and in some lower environments you may not particularly care about the reliability at all. As a result each SLI may need to have different SLOs defined per environment.
However, even if every environment where you run your service, and care about its performance, should target the same SLOs; you should still measure and report on SLO performance separately for each of them. It’s important to know how your service is performing in each environment where its deployed for both capacity planning, and to not have outages in lower environments affecting your production SLO performance. Furthermore, examining SLI samples separately per environment can also allow them to serve as excellent signals for developing issues before they get promoted to higher environments.
SLOs and Shards
SLI/O/As are always focused on consumer experience. However depending on the architecture of a service, it’s possible for any sort of aggregated metric to obscure consumer-experience impact. This is especially true with sharded architectures.
Suppose you have a service which has a hard separation between shards. Certain consumers will connect to separate instances not in a randomized way, but either because they have assigned to a particular shard or because all the data they care about is served by either a subset of shards or a single instance.
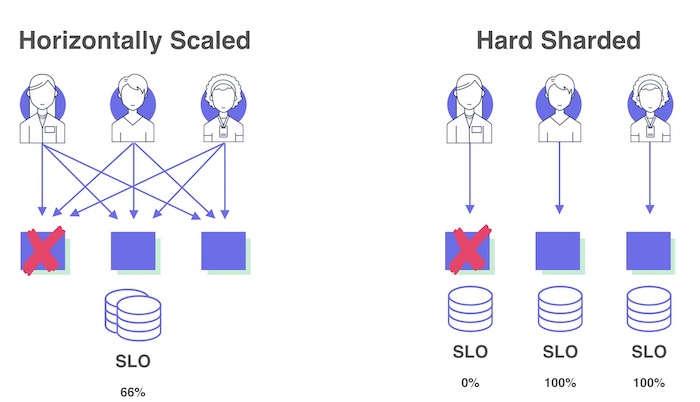 Image Credit
If you measure your SLOs for this sharded service as a single unit you might not understand how reliable your service seems to some of your consumers. If one of the shards becomes unavailable it may only have a relatively minor impact on how the SLIs perform against their SLOs but for those consumers assigned to those unavailable shards, or who only want data served by them, the service is completely unusable. Always make sure that you measure and report on SLO performance granularly enough to properly capture consumer impact.
Service Level Agreement
Service Level Agreements are a threshold which an SLI’s Rollup cannot cross without triggering some business mechanism (external to the team or teams responsible for the service) as a consequence of that violation. They should always be a number lower than the SLO’s lower-bound, and be extremely realistic as they represent a promise of minimum reliability.
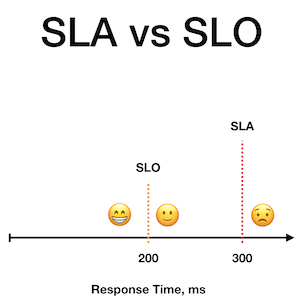 Image Credit
Failing to meet an SLA differs from an SLO Miss in terms of the scope or severity of its consequences. While the consequences of failing to meet an SLO are generally internal to the team(s) responsible for the service and primarily serve to indicate where near-term efforts should be focused, failing to meet an SLA is generally a much more serious matter. This is because failing to meet your SLA means failing to deliver on the promised level of minimum reliability you gave to your consumers.
The consequences for failing to meet an SLA can come in many shapes and forms. For services exposed to external, paying, customers they often are defined as part of a legal customer contract or user-agreement and often involve monetary compensation. Such SLAs serve the purpose of providing customer peace-of-mind and protection. However these SLAs should also have a secondary, internal-only consequence. This internal consequence should not be a punitive one but rather the triggering of some process or mechanism to ensure that necessary resources are provided to the team or service to bring it back into SLA compliance. Internal services (and those which support external facing ones) should also have SLAs which are tied to similar mechanisms to immediately divert the needed resources when a service is in need. However, being able to tie an SLA to such a mechanism (especially internal services) requires a certain level of organizational maturity and broad buy-in, which may not be feasible for all services from day one of adopting SLAs.
Nevertheless, an internal service SLA is still valuable to set in the absence of an associated mechanism to trigger if it is violated, because it communicates to all current and potential consumers the minimum level of reliability they should expect from the service. This will then help as they architect their service to meet their reliability needs.
Best-Effort SLA
Sometimes the business priorities/realities do not allow a team to commit to any SLA threshold. Such services then are given an SLA referred to as a “Best-Effort” SLA.
Picking Good SLI/O/As
Establishing Meaningful SLI Parameters
The established ’normal’ parameters in an SLI definition define how much failure at a point in time (or rather during the last evaluation window) can occur with the consumer still feeling that the capability measured by the SLI is behaving as desired/expected. This definition is important, otherwise it might be tempting to game your SLO by setting more lenient normal parameters for your SLI’s underlying metric(s) to be evaluated against, and thus make it easier to hit a (seemingly) more aggressive SLO. But it’s rather meaningless to brag about your service meeting a 99.9999% SLO if only 1% of all user requests in an evaluation window need to succeed for the SLI to report healthy.
SLIs: Averages vs. Percentiles
When determining how to evaluate metrics within a window for your SLI you should generally avoid picking a definition that uses the average value. Instead it is almost always a better practice to evaluate by percentiles. This is because percentiles help you avoid having your calculations skewed by extreme outliers or metrics that don’t follow fit well within a bell-curve.
Thus, instead of defining your SLI as:
“The mean response time for HTTP requests returning a status code between 100-399 over the last 5 minutes is under 100ms.”
Consider defining your SLI as:
“95% of HTTP requests returning a status code between 100-399 over the last 5 minutes completed in under 100ms.”
Nines
When discussing SLOs and SLAs it’s very common to hear them expressed in terms of “Nines”, such as 4 Nines (99.99) or 8 Nines (99.999999). While an SLO or SLA can be set to any number, it is useful to categorize them by how many of the first digits are 9s (before encountering a number that is not a 9). This gives a rough idea of what level order of reliability a service falls into, and how much investment would be required to improve reliability enough to raise a service to the level.
Each additional Nine is expected to require at least twice the investment needed to achieve the last Nine. Though this may not always hold true, one should expect that adding each additional Nine will incur an exponential cost.
| SLO or SLA | Nines |
|---|---|
| 85.0 | 0 |
| 95.0 | 1 |
| 99.5 | 2 |
| 99.9 | 3 |
| 99.99 | 4 |
| 99.999999 | 8 |
| 100 | ∞ |
The Mythical 100% SLO & SLA
Since no system is perfect, setting either an SLA or the lower-bound of an SLO to 100% is setting yourself up to fail. In terms of Nines, 100% should be considered Infinite Nines, and would thus incur an infinite cost.
Calculating Downtime
Whatever you set for an SLO or an SLA, has a reverse implication: a certain amount of time that it is acceptable during some period for the SLI to be outside of its established parameters. For most SLIs this means: a certain amount of time during the period when some capability of your service is degraded or unavailable. For the Uptime SLI this is the amount of time during that period that the service can be Down.
There are plenty of helpful calculators online (like this one), that can tell you how much acceptable downtime (or degraded functionality time) is implicated by a specific SLO or SLA value.
The Knock-On Effect of SLAs on Dependents
When one service has a critical dependency upon another, its SLAs become constrained by the SLAs tied to the capabilities or uptime of the service it depends upon. It is not possible for an service to promise better or even equivalent reliability to that of its upstream dependencies. Doing so would be the equivalent of promising 100% reliability if your service did not have that dependency; because it effectively means that the only outages or degradations that occur on your service will be the ones caused by outages and degradations in the dependency. (Dividing your SLA by the highest SLA of any of its critical dependencies will tell you what would be the equivalent SLA you’d promise if those dependencies were not a factor.)
This is one reason why it is critically important that a service owner carefully consider their service’s dependencies and their published SLAs in order to be able to set realistic SLAs of their own.

Non-Rollup Based SLOs and SLAs
In some cases it is possible or even desirable to evaluate an SLO or an SLA on a single sample of an underlying SLI. In these special cases the SLI definition includes no established parameters and is not an evaluation of truth but rather a scalar value produced for a single event or transaction. In other words: this would be an Event-Driven SLI which specifies no Normal Parameters.
This metric would then be evaluated against the SLO and SLA for each event/transaction, instead of a rollup of a time-series of samples. Although one could still produce a rollup for the percentage of events/transactions which were within SLO as well as another for the percentage of those which were within SLA.
This per-event/transaction strategy is particularly useful for evaluating support and operations services provided by teams. A support team might establish an SLO and an SLA on the time (latency) it takes to provide the first response to a support ticket, and another SLO and SLA for time between updates, or resolution.
Granted, anything which could be evaluated using a per-event/transaction strategy could also just use the standard rollup based SLO and SLA strategy. But a benefit of the event/transaction based approach is that it gives consumers an expectation of what they can expect from a single interaction with a service as opposed to what they should expect in aggregate. That aspect in particular makes it appealing for support/customer-service interactions.
Defining SLI/O/As For Your Service
The following steps provide a framework for how to fully implement SLI/O/As for your service:
- Find your service boundaries. Identify what is part of your service and what is not. Determine if you have multiple services one service made up various smaller components. Keep in mind that a service could be made up of multiple Kubernetes workloads, as well other cloud resources like databases and queues. Remember that your boundaries should be the line between your service and its consumers (be they users or other services). Everything within your service boundary should should be tagged as being part of that service so that it can get tracked as a unit.
- Enumerate the capabilities your service exposes to consumers. Pay special attention to which ones are part of its core mission and which ones are not.
- Make a note of what outside your service boundary, your service depends on to fulfill its core mission. Find out if they already have published SLAs. If not, and you’re not the owner of that dependency (and thus cannot set SLI/O/As on it yourself), then try to figure out how reliable you expect it to be. A best guess here will suffice.
- For each of your service’s capabilities, determine what type of SLIs would be appropriate and define them.
- Determine what is required to consider your service “Up” and define an Uptime SLI.
- Ensure that all the metrics necessary to inform your SLIs are being collected in New Relic.
- For each SLI determine how you would like to Roll each of them up. Determine an appropriate window size based on your sample-rate to ensure you have enough metrics for a meaninful percentage calculation. Choose between a fixed or a rolling window.
- Determine how many environments your service has, and for which ones you plan to measure and report their reliability.
- Determine how many instances of each SLI you will need in each environment. Will you need to measure the same SLI separately for each shard in your environment? Refer to the above section on granularity for more information.
- Once you have a full window of metrics to drive your SLI, preform a rollup and use that number along with your business needs to define your SLO’s upper and lower boundaries. Decide if you need a separate SLO target for each environment. You may need to start with a smaller window than you might ultimately want if you don’t have enough historical metics, but you can always increase the window size over time.
- After some time of tracking your SLIs and SLOs, in consultation with your service’s stakeholders set an SLA to communicate your minimum guarantees to your consumers.
- Use your SLI/O/As to inform your planning and prioritization, and reevaluate them on an ongoing basis, making adjustments to the SLI/O/A definitions as needed.
Remember that defining SLI/O/As can be tricky and sometimes takes a few iterations to get right. SRE would be happy to offer any help we can in this process, so don’t hesitate to reach out.
Conclusion
Of all the reasons to go through the exercise of defining SLIs, SLOs, and SLAs, perhaps none is quite a important as is enabling data-driven decision making in the development, operations, and planning for a service. They can provide an invaluable tool for ensuring that you are both properly monitoring your service, but also for helping one weight your decisions in terms of consumer experience. They are truly a customer-first approach to business, and help us learn things about our systems we might have otherwise missed.